The road to Paris #COP21 is littered with the bodies of false data sets and bad climate model projections. This latest example from my friend, Steve Goddard.
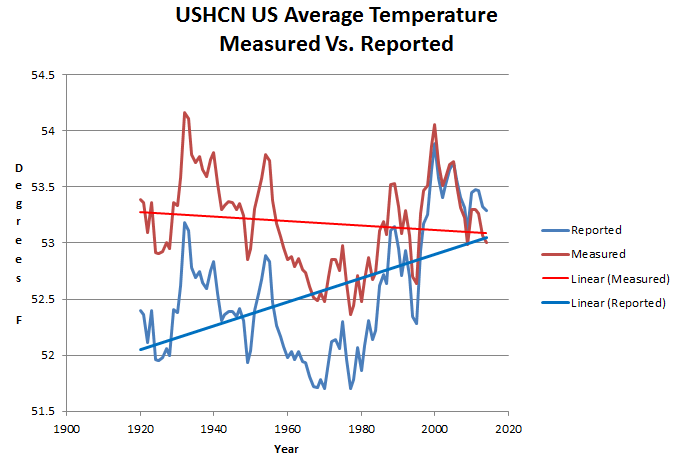
The measured US temperature data from USHCN shows that the US is on a long-term cooling trend. But the reported temperatures from NOAA show a strong warming trend.
Measured : ushcn.tavg.latest.raw.tar.gz
Reported : ushcn.tavg.latest.FLs.52j.tar.gz
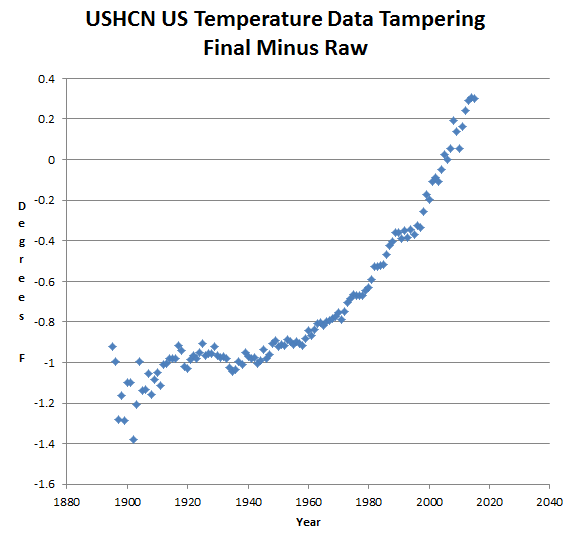
They accomplish this through a spectacular hockey stick of data tampering, which corrupts the US temperature trend by almost two degrees.
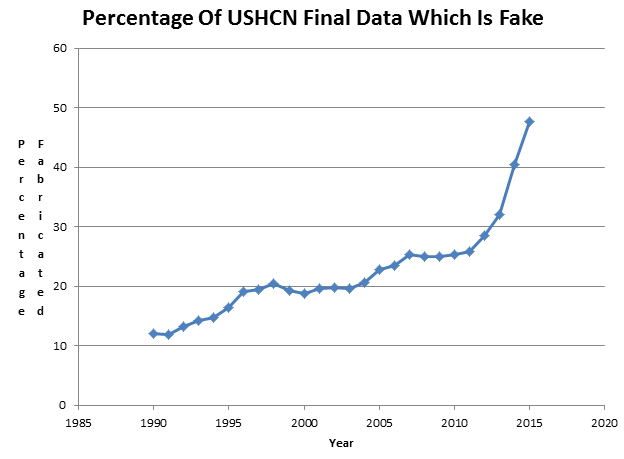
The biggest component of this fraud is making up data. Almost half of all reported US temperature data is now fake. They fill in missing rural data with urban data to create the appearance of non-existent US warming.
The depths of this fraud is breathtaking, but completely consistent with the fraudulent profession which has become known as “climate science”


What the author isn’t telling you is that the U.S. temperature record was designed for weather forecasting and not for long term climate research. As a result changes in the way temperatures have been measured over the decades must be adjusted out of the data in order to make it as uniformly consistent as possible.
The principle change in the measurements that constitute the USHDN network has been a change in the hour the measurements are taken.
There has been a slow shift over the decades from measurements taken in the evening to measurements taken in the morning.
Morning air is obviously cooler than evening air, in general, so in order to make modern measurements compatible with evening measurements the values of the modern measurements must be adjusted upward slightly to compensate.
Now, if you don’t like data adjustments of this kind, then you can ignore the NOAA analysis completely and look at the Berkeley Earth analysis of the raw station data.
Berkeley Earth uses a cleaner method of analysis in which discontinuities in the station data are identified. Once identified the discontinuity is resolved by matching slopes before and after the discontinuity.
This is possible because the absolute value of the temperature is not particularly important, the change in temperature is what is being tracked.